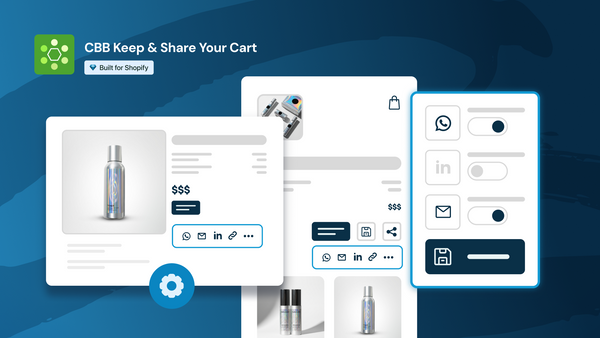
Understanding how shoppers interact with your store can make all the difference between a one-time visit and a loyal customer. That’s why Keep & Share Your Cart now gives you access to in-depth stats that show exactly how your customers are using the sharing feature, helping you turn everyday interactions into insights that drive growth.
Why It Matters
When customers share their cart, they’re doing more than just passing along a link. They’re actively recommending your products to friends, family, or colleagues, expanding your store’s reach organically. With the new stats dashboard, you can finally see how far that reach extends and how people respond.
What You’ll See
The app tracks a few key engagement metrics to paint the full picture:
-
Shared carts
This shows the total number of carts that shoppers have shared using the widget - whether through a link, email, or social networks. It’s a simple way to measure how often customers are taking that extra step to promote your products.
-
Shared carts viewed
This indicates how many times those shared links were opened or viewed by others. The higher this number, the stronger your audience’s curiosity and engagement with shared content.
Your Data, Your Growth
All data displayed is cumulative, meaning it reflects the total activity since you first installed the app. This makes it easy to monitor your long-term growth and identify trends over time.
Maybe you’ll notice that shared carts spike after a specific promotion, or that social shares outperform email links. These insights allow you to tweak your marketing and make small, data-driven adjustments that maximize the impact of your Keep & Share Your Cart widget.
Turn Insights into Action
Think of these stats as your built-in performance compass. They help you:
-
Understand which sharing channels your customers prefer
-
See how often shared carts actually lead to engagement
-
Spot opportunities to encourage more shares through discounts or follow-up messages
The Keep & Share Your Cart statistics are more than just numbers; they’re a window into your customers’ behavior and how they spread the word about your brand.
So, next time you open your app dashboard, take a look at the numbers behind the shares. You might discover a few hidden growth drivers waiting to be amplified.
─────────────────────────────────────────


